Restaurant Analytics and Reports: Turn Daily Data into Better Decisions
You already have the numbers—they sit in bills, UPI settlements, and closing tallies. The hard part is reading them without a CA beside you. This guide focuses on the few reports owners actually use.
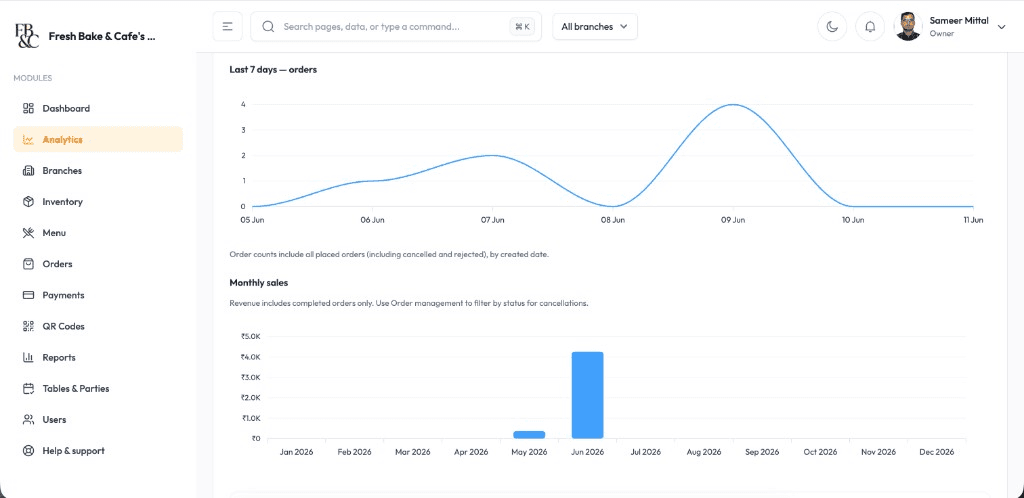
Spend ten minutes a day on sales, top items, and payment mix. Add a weekly look at wastage and labour-heavy hours. That rhythm is enough to catch problems early.
Item-wise and channel-wise sales reports reveal true demand patterns beyond assumptions. With this view, you can improve menu placement, promote high-margin items, and make pricing decisions with more confidence.
Plan staffing using peak-hour trends
When peak-hour patterns are visible, staff deployment becomes smarter. You can align kitchen prep, counter coverage, and floor support to reduce delays and maintain better guest experience during rush periods.
Use outlet-wise reports for expansion decisions
Outlet-wise performance comparisons help you identify stable branches, branches that need process correction, and locations ready for expansion. This makes growth planning practical, not speculative.
Track repeat business to improve retention
Retention metrics help you measure whether guests are returning and which offers or experiences bring them back. This insight supports better loyalty campaigns and stronger long-term revenue predictability.
Close the day with three numbers
Total sales, top five items, and payment split (UPI vs cash vs card). Write them in a notebook or open the app—either works. When those three drift, you know to dig deeper before month-end surprises.
Start with the product pages that match this guide
Book a free demo with your menu, or start setup and try billing, stock, or QR ordering on your own tables.
Key takeaways
Daily totals beat monthly surprises.
Item-wise sales show what to promote and what to drop.
Peak-hour charts help you roster staff where it matters.
Quick checklist for your outlet
1Pick one time daily to open your sales summary.
2Flag any day sales drop more than 15% vs your average.
3Compare two weeks of bestsellers before changing the menu.
4Share a one-page weekly note with your manager or partner.
Questions owners ask us
Answers we hear often from cafe and restaurant owners evaluating billing, stock, or QR ordering.
Daily sales, average order value, top-selling items, cancellation rates, and payment mix are strong starting metrics. These indicators show both revenue and operational health.
Yes. Item-wise performance data helps you promote high-margin dishes, refine pricing, and remove low-performing items that consume kitchen effort.
Track key metrics daily, review trends weekly, and run deeper analysis monthly. This rhythm helps teams act quickly while still planning long-term improvements.
Yes. Shift-level sales and order-volume trends help you deploy staff more effectively during peak and low periods, reducing delays and improving service consistency.
Schedule a Free Demo for Your Restaurant
Share your name and WhatsApp number. We will show weekend-rush ordering, cancellations, and direct-order billing on a sample menu.
Built for every food business format
Whether you run a cafe, bakery, cloud kitchen, fine-dine outlet, food truck, hotel, or dhaba, these workflows are designed to improve speed, control, and guest experience.